pyvista.plotting.charts.BarPlot.labels#
- property BarPlot.labels[source]#
Return or set the this plot’s labels, as shown in the chart’s legend.
Examples
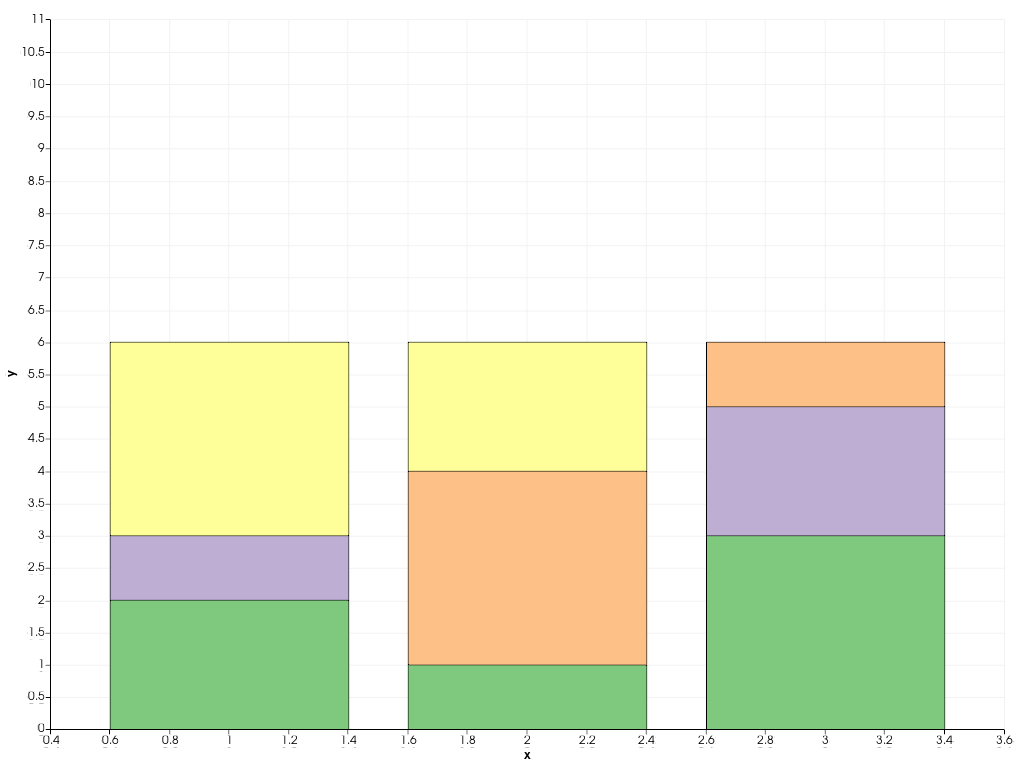
Create a bar plot.
>>> import pyvista
>>> chart = pyvista.Chart2D()
>>> plot = chart.bar([1, 2, 3], [[2, 1, 3], [1, 0, 2], [0, 3, 1], [3, 2, 0]])
>>> chart.show()
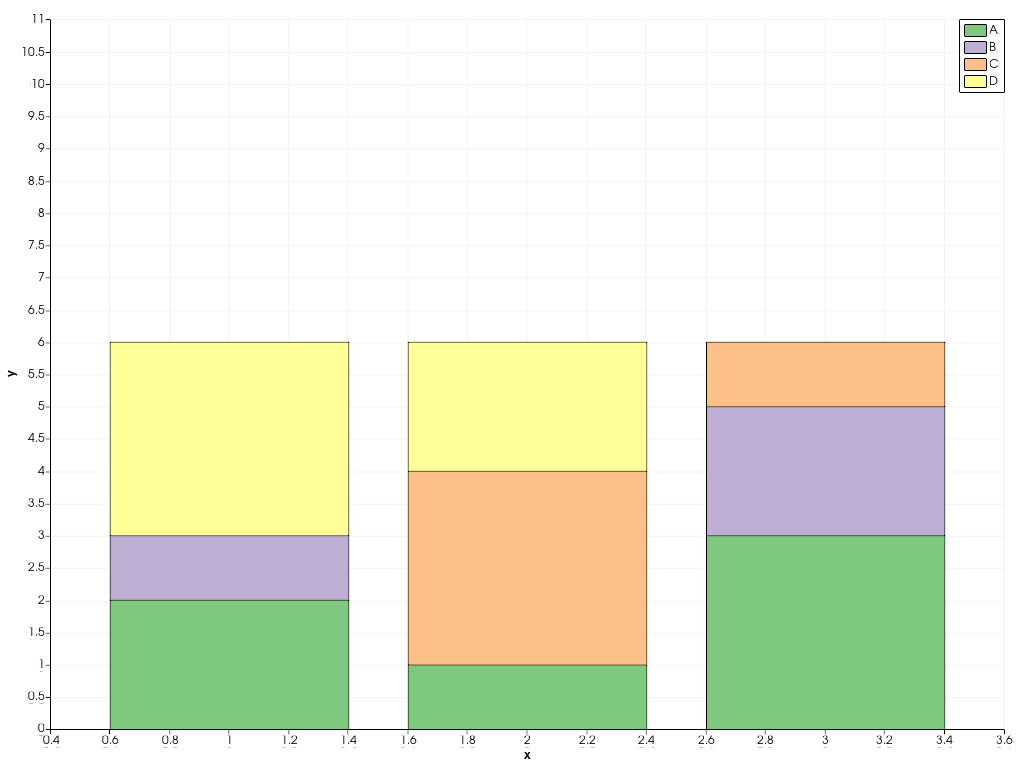
Modify the labels.
>>> plot.labels = ["A", "B", "C", "D"]
>>> chart.show()