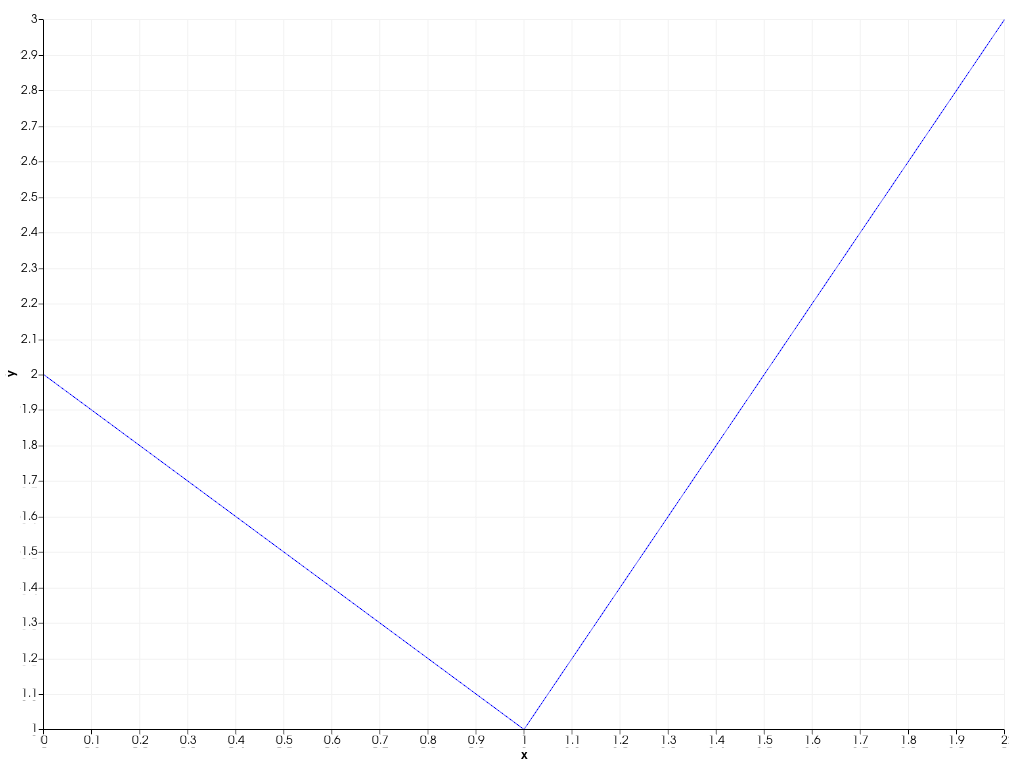
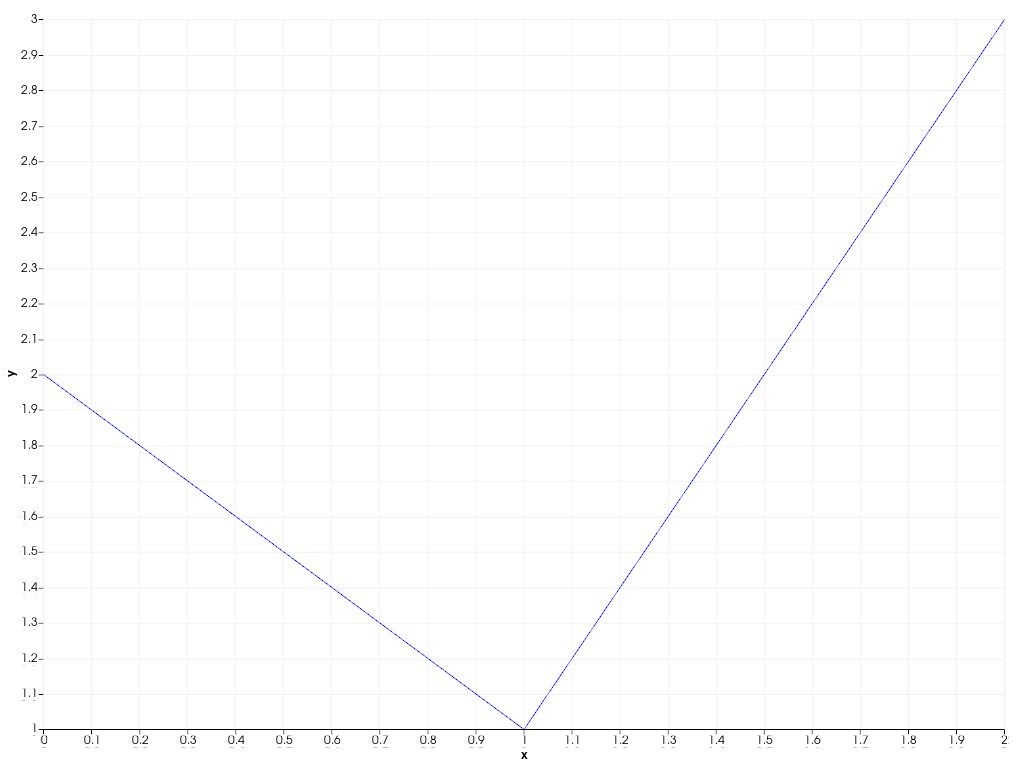
pyvista.plotting.charts.Axis.toggle# Axis.toggle()[source]# Toggle the axis’ visibility. Examples Create a 2D chart. >>> import pyvista >>> chart = pyvista.Chart2D() >>> _ = chart.line([0, 1, 2], [2, 1, 3]) >>> chart.show() Toggle the visibility of the y-axis. >>> chart.y_axis.toggle() >>> chart.show()