pyvista.RectilinearGrid.dimensions#
- property RectilinearGrid.dimensions: Tuple[int, int, int][source]#
Return the grid’s dimensions.
These are effectively the number of points along each of the three dataset axes.
Examples
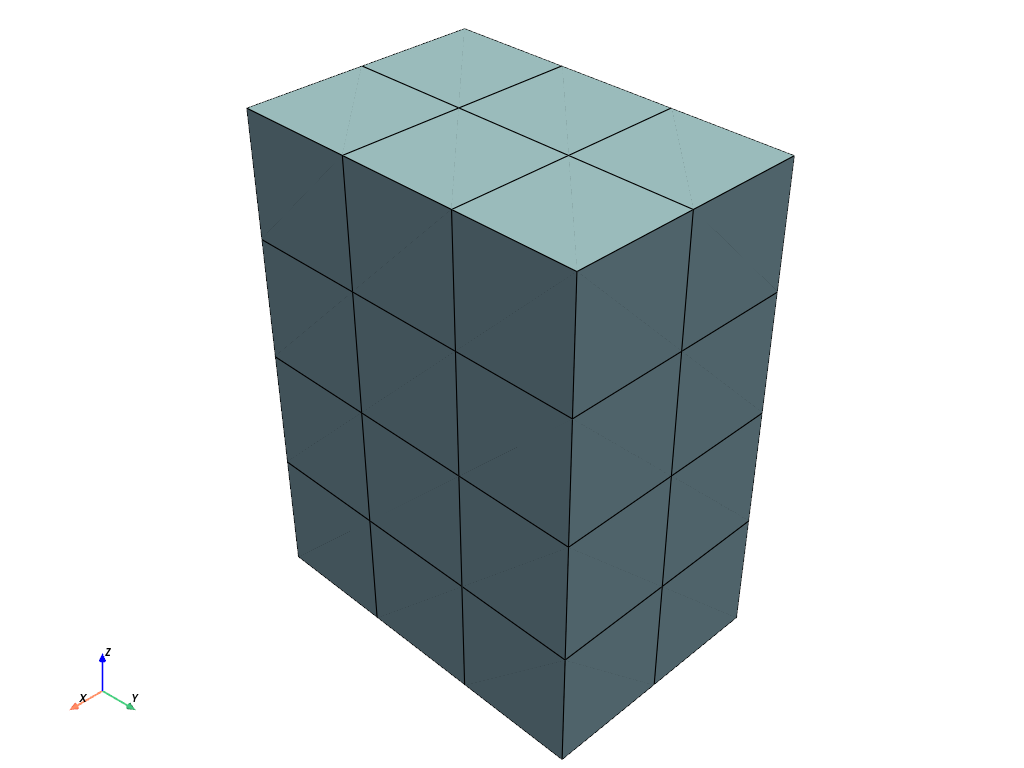
Create a uniform grid with dimensions
(1, 2, 3).>>> import pyvista >>> grid = pyvista.ImageData(dimensions=(2, 3, 4)) >>> grid.dimensions (2, 3, 4) >>> grid.plot(show_edges=True)
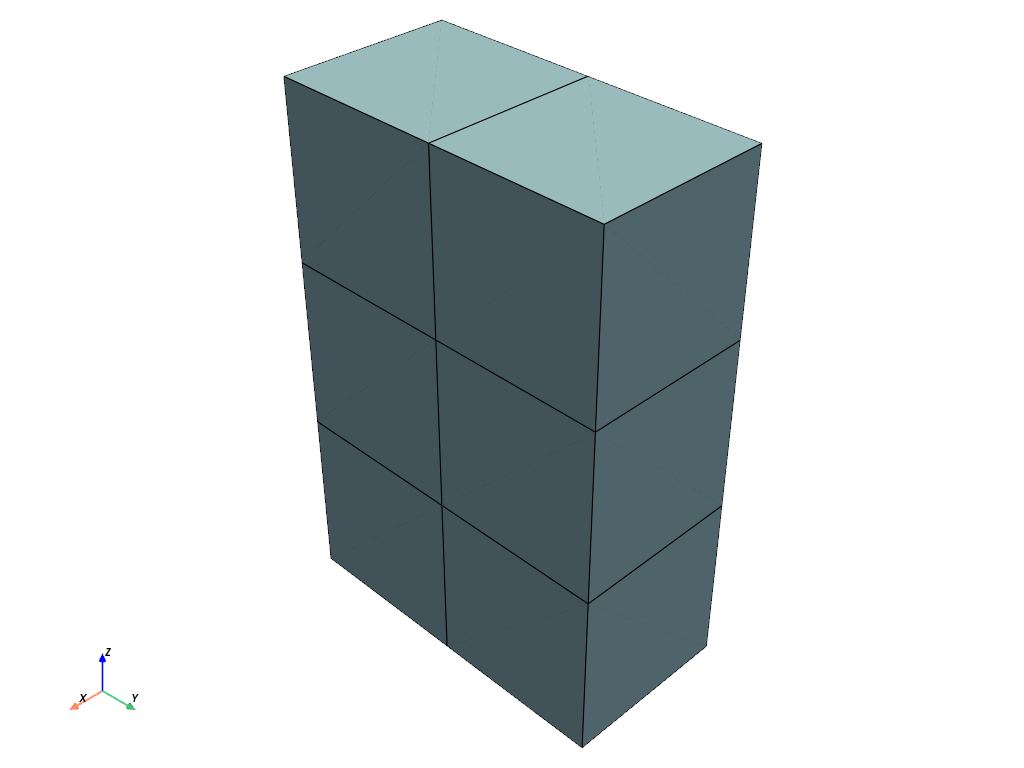
Set the dimensions to
(3, 4, 5)>>> grid.dimensions = (3, 4, 5) >>> grid.plot(show_edges=True)